Giant Donut Test (WET-005)#
Note
This technote is a work-in-progress.
Abstract#
This technote relates to the WET-005 Test from the Active Optics Commissioning (AOS) Test List. This test uses both regular and giant donuts to validate the wavefront estimation pipeline and identify high-frequency mirror errors. Additionally, this test compares the effect of elevation on the optical path differences (opd). This test covers all six filters, as well as three different zenith angles at 0, 30, and 60 degrees. Currently, this data only reflects the Commissioning Camera (ComCam) and will eventually include the main LSST Camera (LSSTCam).
The notebook used to generate the data for this technote can be found here.
Background#
The process for this test relies on two major AOS software packages, the wavefront estimation pipeline (WEP) and the optical feedback control (OFC). First, both an extrafocal and intrafocal donut is passed through the WEP to obtain the wavefront zernikes of Noll index 4-22. The WEP generally does this by taking advantage of the wavefront senors in each corner of the focal plane of the LSST Camera. At each corner, there is a split CCD with one half above and one half below the focal plane to provide intra- and extrafocal donuts for every exposure. Since ComCam does not have wavefront sensors, exposures were simulated above, below, and equal to the focal plane for each configuration to generate intra- and extrafocal donuts.
Then, these zernike values are passed through the OFC, which takes zernike values and converts them into an estimation of the input degrees of freedom for the telescope system. There are 50 degrees of freedom for the Simonyi Telescope that reflect the position of the camera and M2 mirror, as well as the bending modes for the M1M3 monolith. These estimated values are then compared back to the input values and compared by elevation.
Simulation#
Exposures were simulating using the imSim package. ComCam is one raft consisting of nine CCDs. Since ComCam does not have wavefront sensors, a separate exposure was simulated to generate the intra-, extra-, and in-focus images. Therefore, an entire ComCam exposure was simulated for -7.5mm, -1.5mm, 0mm, 1.5mm, and 7.5mm of defocus. Each defocus was simulated in all six bands, at three zenith angles, for a total of 90 full ComCam exposures.
The injected, true degrees of freedom were entirely set to zero with the exception of the defocus of the camera, which is the sixth degree of freedom.
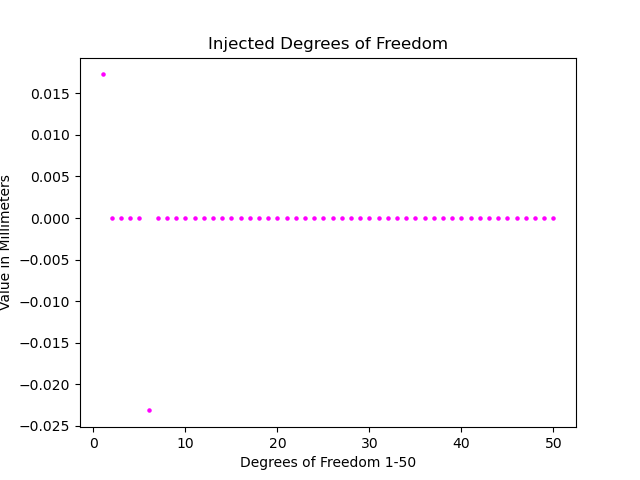
Fig. 1 Injected degrees of freedom for each camera defocus to generate donuts.#
The following conditions were used to simulate the data, with an MJD corresponding to the evening of July 23rd, 2024.
Zenith Angle |
RA |
Dec |
|---|---|---|
0.0 deg |
14:07:46.30 |
-26:48:07.50 |
30.0 deg |
19:18:10.60 |
-45:25:22.70 |
60.0 deg |
11:58:29.00 |
-85:56:23.60 |
All images are in the following location: /sdf/group/rubin/user/rp312/ComCam/Giant_Donut, and are not yet ingested into the AOS butler.
Results#
Due to the size of the giant donuts used in this test, generated at a defocus of +/-7.5mm, it was not possible to avoid blending. A flux cutoff of 4.e6 was used to obtain the brightest possible sources that would not rely on the Fast Fourier Transform algorithm (FFT). At this time, objects simulated in imSim which are bright enough to switch to the FFT algorithm cannot be defocused. Only the giant donuts are significantly affected by blending and lower signal-to-noise. Figures 2 and 3 are cutouts of the same star.
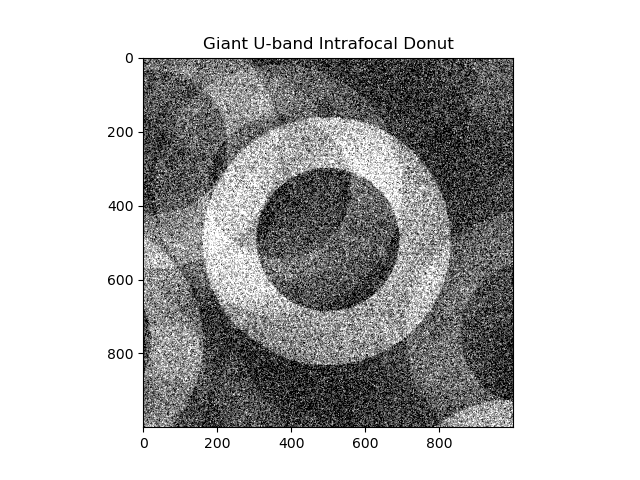
Fig. 2 Cutout of a giant intrafocal donut in the u-band, on detector 002 at a zenith angle of 0.0 degrees.#
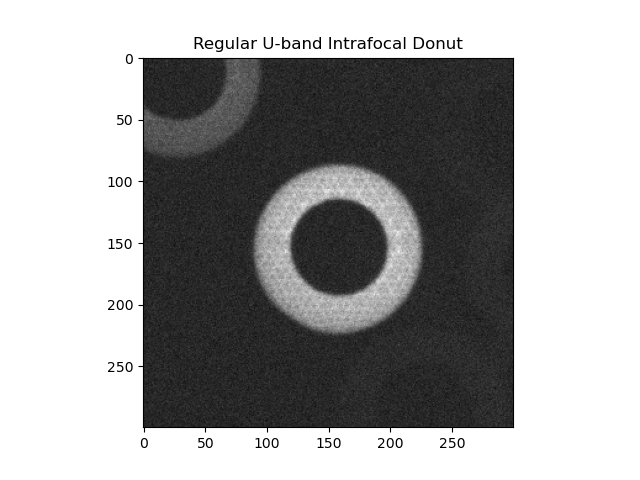
Fig. 3 Cutout of a regular intrafocal donut in the u-band, on detector 002 at a zenith angle of 0.0 degrees.#
Donuts like these, depcited in Figures 2 and 3, are an example of what would be passed through the WEP and OFC algorithms to generate the following results. The standard deviation of the intensity is 25.74 electrons per pixel for the giant donut and 41.97 electrons per pixel for the regular donut. This result confirms that there is a much higher signal-to-noise ratio for the regular donuts.
Wavefront Estimation Results#
At this time, there is an unidentified issue with the wavefront estimation pipeline that generates a large value for the zernike coefficient with a Noll index of 4, which corresponds to defocus.
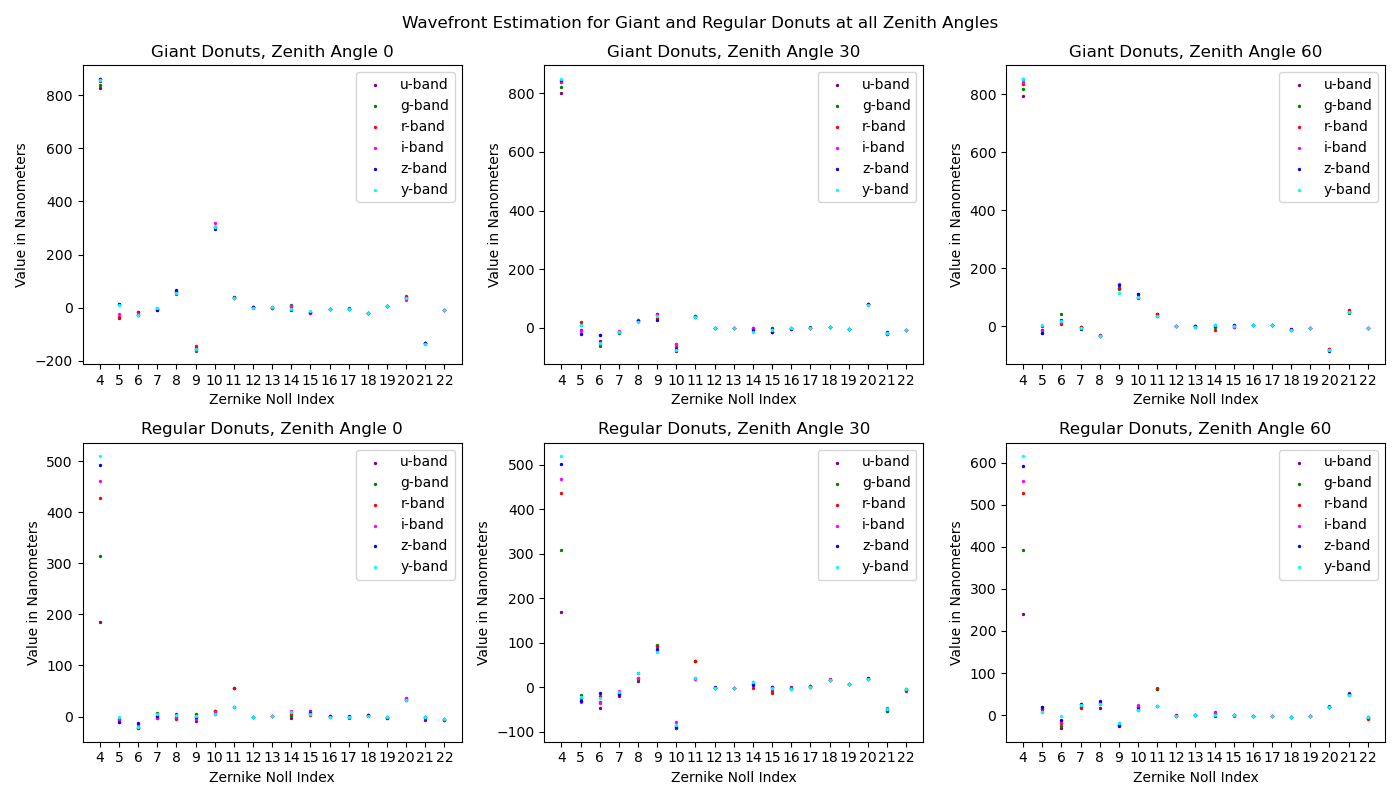
Fig. 4 Wavefront estimation for giant and regular donuts at all zenith angles.#
In Figure 4, the spike for the defocus is clear on all six subplots. It is more pronounced for the giant donuts than the regular donuts, but still affects the regular donuts. More clearly for the regular donuts than the giant donuts, there appears to be some correlation with the offset to the filter. For example, in the u-band, the offset is consistently smaller than the other bands. Despite being less noticeable in the giant donuts, they follow the same pattern.
Simulating donuts with an atmospheric point spread function (PSF) should affect the zernike corresponding to defocus by making the donuts appear larger, however this effect would cause the largest offset in the u-band moving to the y-band, not the other way around.
Optical State Estimation Results#
Conversely to the wavefront estimation results, the filters with the biggest offset in the WEP have the smallest offset in the OFC.
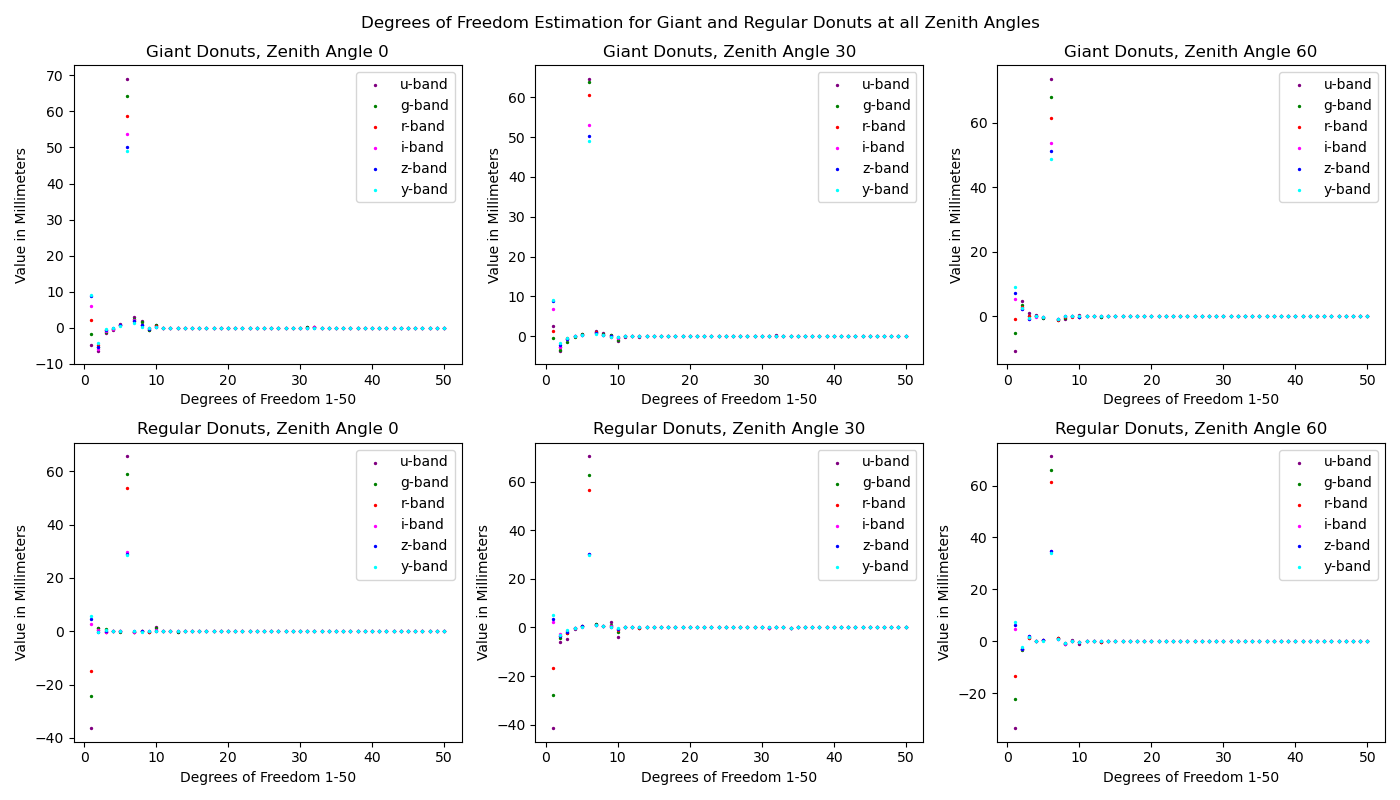
Fig. 5 Degrees of freedom estimation for giant and regular donuts at all zenith angles, corresponding to the optical state of the telescope.#
There are fifty degrees of freedom for the telescope system. The first ten correspond to the hexapods for the M2 mirror and the camera. The other forty are for the bending modes of the M1M3 monolith. The simulations here primarily affect the hexapod degrees of freedom, and the bending modes stay very stable. The giant donuts see a significant offset for the sixth degree of freedom, corresponding to camera dz, or defocus. This is to be expected if the error from the WEP is propogating through when the zernike arrays are then passed to the OFC. However, the regular donuts also show an offset for the first degree of freedom, which corresponds to the M2 dz, or defocus of the secondary mirror in addition to the camera.